
Brilliant Reversal Indicator for MT5: How the Trend Reversal Indicator Works
A trend reversal is one of the most difficult moments for technical analysis. As long as the movement is already evident, a significant portion of the impulse can be traversed. Therefore, traders use various tools that help to visually find potential changes in the direction of the price.
Brilliant Reversal Indicator for MT5refers specifically to such instruments. It is designed to find potential pivot points directly on the price chart and displays them using visual markers.
In practice, this allows you to quickly see where the market is forming a local high or low, and then compare the signal with the price structure, support and resistance levels, and other elements of technical analysis.
It is important to understand that the indicator does not determine the future price movement with a guarantee.The reversal signal is primarily a technical benchmark that requires additional assessment of the market context.
How the Brilliant Reversal Indicator Works
The main task of the indicator is to visually highlight potential points of change in the direction of price movement.
Download Brilliant Reversal Indicator for MT5
The AUDJPY H1 chart shows markers appearing near local highs and lows. This allows you to use the indicator as a kind of layer on top of the usual price chart: instead of independently analyzing each top and trough, the trader receives additional visual markup.
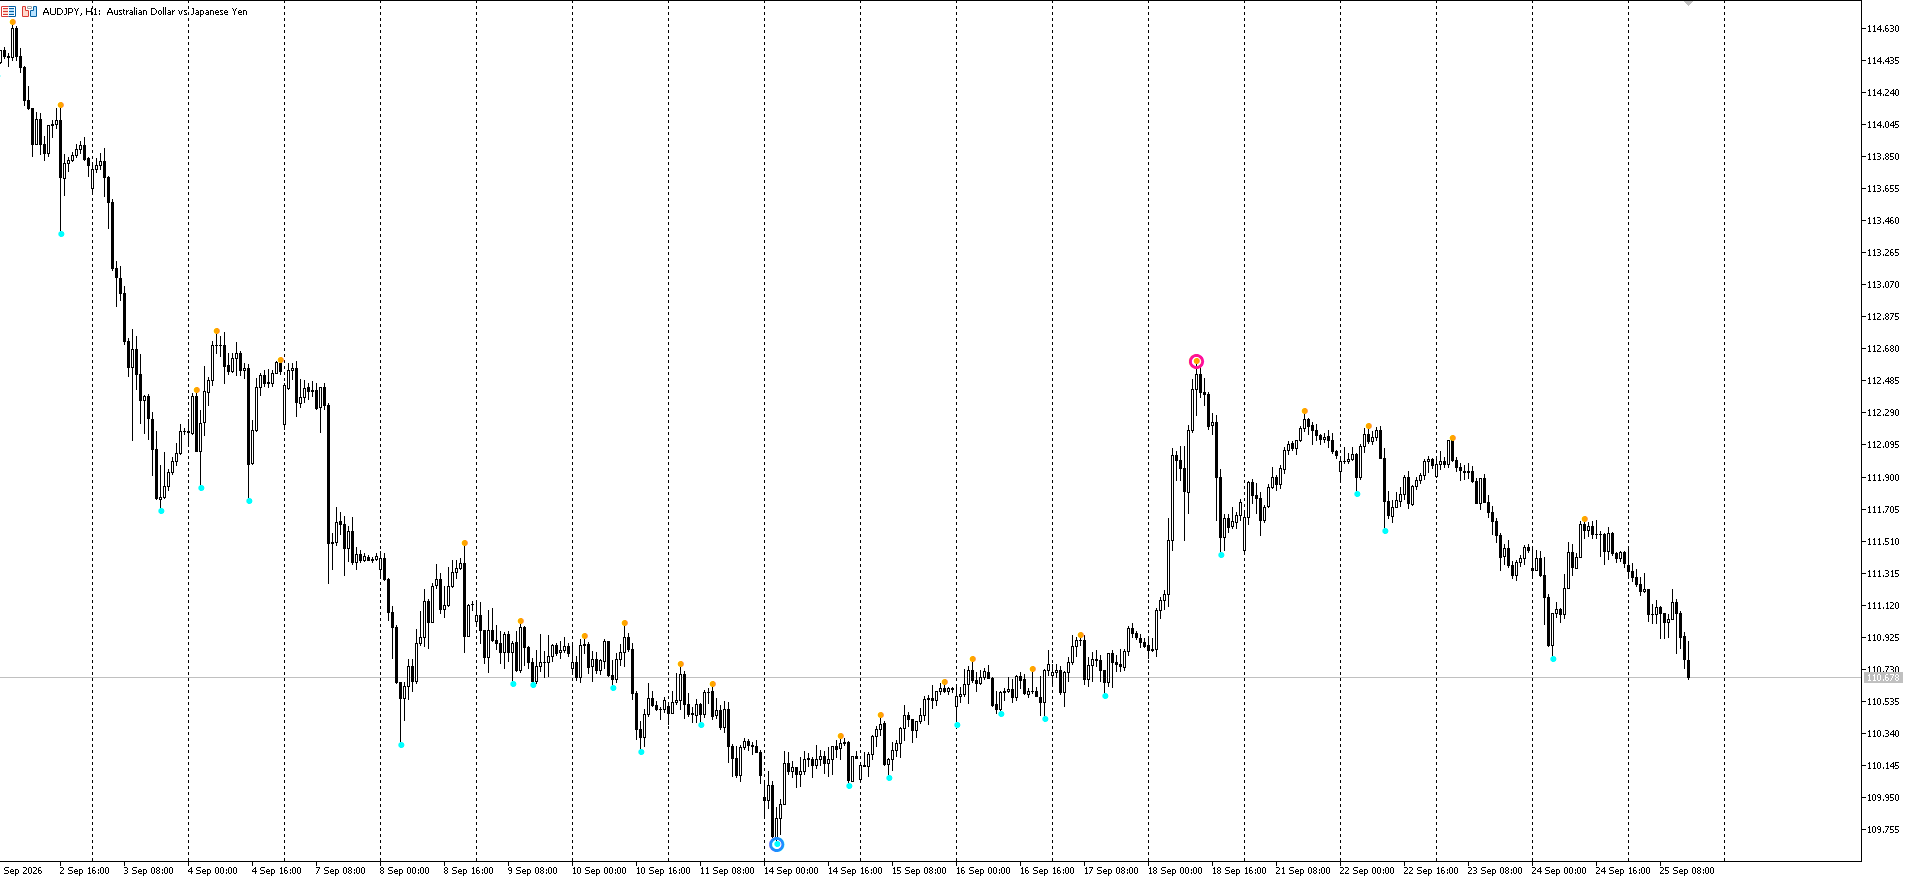
Brilliant Reversal Indicator on the AUDJPY hourly chart: markers highlight potential points of price movement.
Why price breakdowns are used for U-turns
Reversal rarely occurs at a single point. Usually it is preceded by a certain structure: the price movement forms a local extreme, then the opposite impulse appears, after which the market can go into a new phase.
Therefore, tools that track local highs and lows can be useful as an additional way to analyze the structure of the market.
In the description of Brilliant Reversals on MQL5, the indicator is presented as a tool for determining potential points of trend reversal and supporting decisions regarding possible moments of entry or exit.
At the same time, the token itself should not be considered as an independent trading solution.
For example, a potential upward reversal may make more analytical sense if at the same time:
price is near a significant support level;
the previous downward impulse weakens;
a reversal candlestick structure is formed;
the senior timeframe does not contradict the scenario;
confirmation appears after closing the candle.
Thus, the main value of the indicator is not to replace analysis, but tospeed up the search for potential points of interest on the chart.
Brilliant Reversal Indicator Settings in MT5
In the presented indicator configuration, two main parameters are available:
slow zigzag period — 42
fast zigzag period — 6
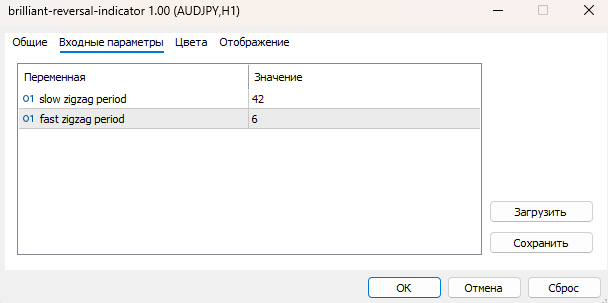
Brilliant Reversal Indicator parameters in MT5: slow zigzag period — 42 and fast zigzag period — 6.
Fast and slow parameters
The very presence of fast and slow periods indicates the use of two levels of sensitivity to price movements.
A shorter period allows you to take into account shorter market fluctuations, while a longer period is used for larger price movements.
However, the specific effect of changing each parameter depends on the implementation of the indicator and the tool selected. Therefore, you should not automatically assume that increasing or decreasing the value makes the signal "better".
Changing the parameters primarily changes the nature of the displayed extremes and the number of oscillations taken into account.
Brilliant Reversal Indicator and ZigZag
The name of the parameters is directly related to ZigZag, a technical analysis tool that is used to visually highlight significant price movements and local extremes.
This is an important point when interpreting the indicator.
ZigZag helps to remove some of the market noise and focus on more noticeable price fluctuations.Therefore, the extreme approach is well suited for visual analysis of potential reversals.
But this approach has an important limitation:the extreme becomes apparent only after the appearance of a subsequent price movement.
Therefore, a visually beautiful signal on a historical chart cannot be automatically perceived as an accurate signal that was available to the trader in real time in the same form.
This is especially important when testing such tools.
How to read signals on a graph
When working with the Brilliant Reversal Indicator, it is useful to separate three different stages.
1. Finding a potential extreme
The first step is to determine where the indicator highlights a possible vertex or trough.
At this point, the marker is just a point of interest.
2. Checking the price structure
Then you need to see what happens to the price itself.
For example:
whether the previous trend persists;
whether a new local maximum or minimum has been formed;
whether there was a breakdown of the structure;
whether the price is near an important tier
whether there is a confirmatory candlestick formation.
3. Scenario validation
The last step is to wait for the confirmation of the selected scenario according to your own trading system.
This is especially important because the reversal indicator cannot eliminate the fundamental uncertainty of the market.
Where the Brilliant Reversal Indicator can be useful
The tool can be used in several analytical scenarios.
Search for potential reversals
The main application is to search for areas where the direction of price movement can potentially change.
Analysis of local highs and lows
Markers help to visually highlight extremes and quickly assess the structure of the chart.
Working with price action
The indicator can be used as an additional layer of analysis together with Japanese candlesticks, support and resistance levels and market structure.
Plot filtering
For a trader who does not want to manually mark each local extreme, such visual markup can make chart analysis faster.
What the indicator doesn't do
It is important to separate the function of the instrument from the trader's expectations.
The Brilliant Reversal Indicator should not be seen as a mechanism that knows in advance where the trend will end.
Even if the token is historically located almost at the top or bottom of the movement, this does not mean that a similar result will be obtained in each new market situation.
Therefore, it is more reasonable to use the indicator asa tool for searching and filtering potential situations, rather than as a trading system in its own right.
Default settings and optimization
Values42and6shown in the provided screenshot can be used as the initial configuration for testing.
But you should not change the parameters just for the sake of increasing the number of "beautiful" historical signals.
When optimizing the indicator, a classic problem of technical analysis arises: the more the settings adjust to the previous graph, the higher the risk that the result will work worse on new data.
Therefore, it is advisable to check any changes in the parameters:
on several instruments;
at different time intervals;
on historical data;
on a separate period that was not used for tuning.
Brilliant Reversal Indicator for different timeframes
Potential reversals look different depending on the timeframe.
In the lower periods of the chart, there will be more price noise and local fluctuations.
On older timeframes, individual movements become larger and may better reflect the mid-term market structure.
Therefore, the same indicator can be used in multilevel analysis.
For example:
Senior timeframe → direction and structure
Junior timeframe → search for a local point of interest
This approach makes it possible not to perceive each individual signal in isolation.
How to install Brilliant Reversal Indicator in MT5
After receiving the indicator file, it must be added to the MetaTrader 5 custom indicator directory.
The general order is as follows:
Open MetaTrader 5.
Go toFile → Open Data Folder.
Find Folder
MQL5.Open directory
Indicators.Place the indicator file in this folder.
Restart MetaTrader 5 or refresh the Navigator window.
Find the indicator in the Indicators section.
Drag it to the desired graph.
Check the parameters and pressOK.
If a ready-made file is used, the exact installation process may depend on its format and how it is distributed.
What to track when using the indicator?
1. Closing the candle
It is not necessary to interpret the position of the marker before the completion of the formation of the corresponding candle as the final signal.
2. Senior timeframe
A local reversal on H1 may turn out to be just a correction within a larger movement.
3. Support and resistance levels
A potential reversal becomes more interesting from an analysis point of view if it coincides with a predetermined area of the market.
4. Price structure
Keep an eye on the sequence of highs and lows, not just the individual marker.
5. Volatility
The same signal can have a completely different meaning in a calm and highly volatile market.
6. Confirmation
Use additional elements of technical analysis if they are part of your trading system.
Main conclusion
Brilliant Reversal Indicator for MT5 is a visual tool for finding potential pivot points and analyzing the local price structure.
Its strong point is the simple display of potential extremes directly on the chart. The fast and slow parameters allow you to work with different levels of price fluctuations, and visual markup can speed up the search for areas of interest on the chart.
However, any reversal indicator must be seen in the context of the market structure.
The marker on the chart is the beginning of the analysis, not its end.
Follow the movement of world markets and technical analysis tools together withAVORA MARKETS.