
Gold is falling. But why doesn't the market look truly bearish?
After a powerful upward movement, gold entered a correction phase.
On the current XAU/USD chart, the price has retreated from the $4,390–4,400 area and approached the $4,300–4,320 area.At the time of writing, spot gold was around $4,328 per ounce, and pressure on the market increased after tougher signals from representatives of the Federal Reserve System.
At first glance, everything looks quite simple.
High rates → stronger dollar and bond yields → gold under pressure.
But there is a second side to this story.
While short-term capital is reducing positions, much longer-term buyers continue to be present in the market:central banks, gold ETFs and investors from Asia.
This is why it is more interesting to consider the current gold correction not as a simple question of “will XAU/USD go down”, but asa test of where the real demand is.
Three XAU/USD Levels to Watch Now
The presented graph highlights three zones that can be used as guidelines to search for potential customer reactions:
$4 292,75
$4 267,37
$4 241,99
These are not guaranteed turning points or automatic buy signals. These are technical levels from the provided chart, around which it is especially important to observe the price behavior.
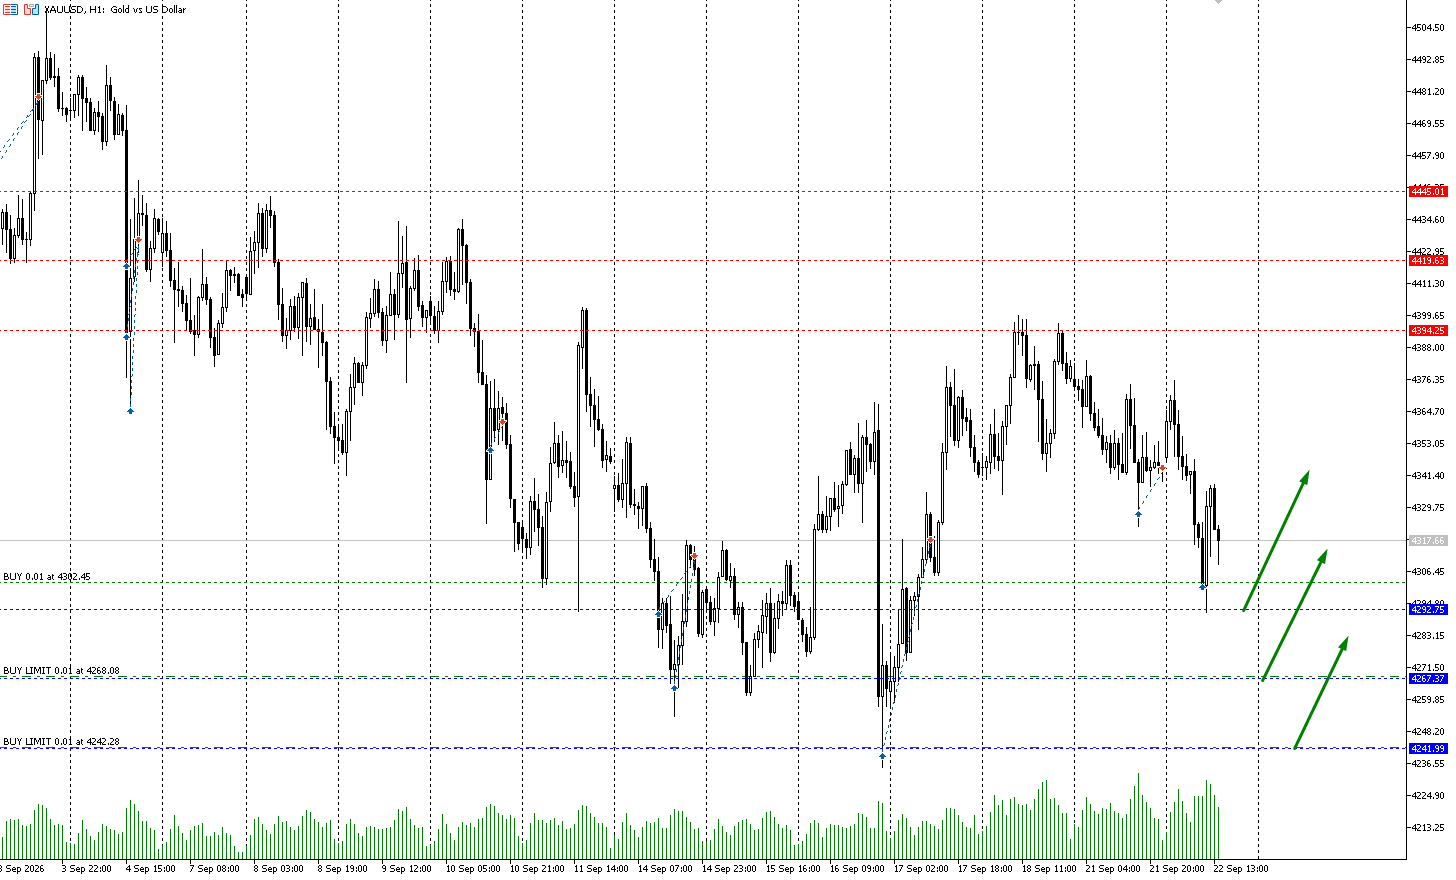
XAU/USD: Three key areas of potential demand - $4,292.75, $4,267.37 and $4,241.99.
$4,292.75 - first attention zone
The closest level is about$4 292,75.
This is the first area that the market can test if the current correction continues.
What is important here is not touching the level itself, butprice reaction.
If sellers lose momentum and buyers begin to actively buy back the decline, $4,292 could be the starting point for a recovery to higher values.
If the price passes this level down without a significant reaction, attention switches to the next zone. $4,267.37 - deeper correction
The next level is around$4 267,37.
It is interesting for buyers because here the correction is already becoming quite deep relative to the last impulse.
If XAU/USD falls into this area, the market will actually have an opportunity to test how strong demand remains after the initial sell-off.
It is especially important to keep an eye on:
rate of descent;
volumes;
the length of the lower shadows of the candles;
the ability of prices to return above the level after the test;
behavior of the dollar and Treasury yields.
If the price quickly returns above $4,267 after breaking through the level, it will be a completely different picture than persistently consolidating below it.
$4,241.99 – lower zone from the current scenario
Third level -$4 241,99.
This is the deepest of the three designated zones.
If the market gets here, the correction will be significantly larger than the initial pullback. But that's why the reaction near this area can be especially interesting.
It is fundamentally important for the buyerWill the decline remain a controlled correction or will it turn into a change in the medium-term market structure.
Therefore, $4,242 should be perceived not as a “guaranteed bottom”, but as the last of the three zones of the current technical scenario.
But the most interesting thing is not on the chart
Technical levels showwheredemand may arise.
Macroeconomics helps us understandWhy would this demand even appear?.
And here the situation is much more interesting than it might seem after one glance at the chart.
China increases gold reserves again
One of the most important factors in the global gold market right now is China.
According to the World Gold Council, in August the People's Bank of China reported purchasing approximately20 tons of gold.
This was the Chinese regulator's largest monthly purchase since October 2023.
At the same time, China is already increasing its gold reserves22 months in a row.
And this is important for one reason.
A central bank that builds a reserve portfolio operates very differently from a short-term trader.
If a speculative investor can close a position after a move of a few percentage points, the central bank may view gold as part of a long-term reserve structure.
Therefore, such purchases create a potentially more sustainable source of demand.
China doesn't just buy gold through its central bank
There is an even more interesting detail.
According to the Financial Times, in the first eight months of 2026, China importedmore than 1,000 tons of gold, spending about $158.8 billion on this.
For comparison, for the whole of 2025 the country imported about 886 tons.
The growth in demand is not only due to government actions. Chinese retail investors are also increasing interest in gold amid a weak real estate market, low government bond yields and the limited attractiveness of some domestic assets.
This results in an interesting design:
Chinese demand = central bank + investment demand + physical market.
This is why Chinese market dynamics are becoming increasingly important to the global gold price.
ETFs are returning to the gold market
But China is far from the only buyer.
August was a particularly big month for gold ETFs.
According to the World Gold Council, global physically-backed gold ETFs have gained approx.$18 billion in inflowper month.
It was the second largest monthly inflow in market history.
Total ETF assets rose 16% over the month to approximately$615 billion, and the volume of gold in the funds increased by121 tons, reaching record4,189 tons.
Moreover, the demand was wide.
European funds attracted about$7.9 billion, American - about$7.7 billion, Asian - about$2 billion.
This is an important signal.
Buying gold no longer looks like an exclusively Asian story.
Western investment capital has also returned to the metal.
Why are investors buying gold again?
This is where the macroeconomic part of the story begins.
In August, gold received support from several factors at once.
The World Gold Council noted among them:
growing concerns about the state of government finances;
increasing long-term returns;
concerns about the sustainability of the US government debt market;
expectations regarding monetary policy;
strengthening of price impulse after the breakdown of technical levels.
That is, some investors did not buy gold because they expected an immediate reduction in rates.
Vice versa.
Gold is increasingly being used as a way to diversify a portfolio amid questions about government debt and currencies.
This is why the market is able to remain resilient even when the classic “bet up, gold down” model works against it.
And now the main opponent of gold is the Fed
This factor cannot be ignored.
As of September 22, 2026, US monetary policy remains one of the main short-term risks for XAU/USD.
The Fed recently raised rates on25 basis points, and representatives of the regulator continue to point out the need to fight inflation.
According to Reuters, the market has already estimated the likelihood of another rate hike in December at approximately90%.
This is a problem for gold.
Gold does not pay interest.
American bonds pay.
Therefore, the higher the real yield on dollar instruments, the higher the opportunity cost of owning gold.
This is what is currently creating pressure on XAU/USD.
It turns out to be a paradox
There are two opposing forces in the market at the same time.
Factor #1 - Fed
High rates and likelihood of further tightening:
pressure on gold.
Factor No. 2 - structural demand
Central banks, China, ETFs and investors looking for safe haven assets:
gold support.
That is why the current movement looks more interesting than a regular correction.
The market is actually trying to determineWhich of these forces will be stronger.
What will happen to gold next?
At the current stage, there are several scenarios.
Scenario 1: Buyer Protects $4,292
Price tests$4 292,75, sellers do not receive continuation of the movement, and XAU/USD returns above $4,300.
In this case, attention can again switch to the area of recent local maxima.
For buyers, this will be the first sign that the correction has met demand.
Scenario 2: gold goes to $4,267
A break of $4,292 does not necessarily mean the start of a long-term bearish trend.
Next zone -$4 267,37.
Here the market gets another opportunity to form a reaction.
The situation will be especially interesting if the price quickly returns above the level after testing it.
Scenario 3: deep correction to $4,242
If pressure increases, XAU/USD may head towards$4 241,99.
Then the market will be in front of the most important zone presented on the chart.
If strong demand appears near it, the correction could potentially move into a new accumulation phase.
If the price confidently consolidates lower, the current technical scenario will require revision.
What data can change the picture?
To understand the direction of gold, it is now not enough to look only at XAU/USD itself.
There are several indicators to keep an eye on.
US bond yields
This is one of the most important short-term factors.
Rising yields typically increase gold's opportunity cost.
US dollar
A strong dollar can create additional pressure on XAU/USD.
The weakening of the US currency, on the contrary, may facilitate further growth for gold.
Central bank purchases
Continuing purchases is especially important for the long-term structure of demand.
China has already shown an acceleration in purchases in August.
Gold ETF Flows
This is one of the most convenient ways to see if institutional capital is moving back into gold.
August showed an extremely strong signal:$18 billion inflows and record 4,189 tons of gold in the ETF.
Inflation and energy
Another interesting paradox appears here.
Rising oil prices could raise inflation expectations while forcing central banks to maintain tighter policies.
For gold, this creates a multidirectional effect:
inflation risks → support for gold
but
higher rates in response to inflation → pressure on gold.
Therefore, in the coming months it is important to look not only at inflation itself, but also atthe Fed's reaction to it.
So who's buying gold now?
When you put the picture together, the answer is much more interesting than just “central banks.”
Now there are several large sources of demand on the market at the same time:
Chinese central bank— continues to increase gold reserves.
Chinese investors— increase gold imports against the backdrop of internal economic factors.
ETF— in August they received one of the largest influxes in history.
European investors— showed a record monthly inflow into gold ETFs.
North American investors— also sharply increased purchases in August.
And opposite them is now one of the main sellers -macroeconomic factor of high US interest rates.
Gold is now testing more than just support - it is testing the quality of demand
That's why the levels$4,292.75, $4,267.37 and $4,241.99become interesting.
Not because any one of them will necessarily become the bottom.
But because the price reaction near these zones will help answer a much more important question:
Is big capital ready to continue buying gold after the correction?
If so, the market can use the decline to form a new wave of demand.
If not, pressure from rates and yields may control the move.
For now, the fundamental picture remains mixed:In the short term, the Fed is creating pressure, but structural demand from central banks, China and ETFs continues to support the market.
That is why the current gold correction should not be considered in isolation, but in the context of the entire global capital flow.
What should a trader do?
The main mistake in such a situation is to try to guess the exact bottom.
It is much more rational to determine areas of interest in advance and then observe the market reaction.
In the current scenario it is:
$4 292,75 → $4 267,37 → $4 241,99
If the price approaches one of the zones, it is important to evaluate not only the level itself, but also the context:
what is happening to the dollar;
where Treasury yields are heading;
what is happening with expectations for the Fed;
whether ETF purchases are saved;
whether central banks continue to increase reserves;
how XAU/USD itself behaves after the level test.
It is the combinationmacro + capital flows + technical reactiongives a more complete picture than one indicator or one line on a chart.
Bottom line
Gold is now caught between two powerful forces.
On the one hand -Fed, high rates and US bond yieldswhich create pressure on XAU/USD.
On the other hand -China, central banks, ETFs and global demand for safe haven assets, which continue to shape structural demand.
August showed just how powerful the return of investment capital can be: gold ETFs raised nearly $18 billion and their total holdings reached a record 4,189 tons.
At the same time, China continues to increase its official gold reserves, and its total gold imports in the first eight months of 2026 exceeded 1,000 tons.
Therefore, the current correction is, first of all,demand test.
On the technical chart, the key areas to watch remain:
$4 292,75
$4 267,37
$4 241,99
If the buyer proves itself in these areas, the market will have the opportunity to generate new momentum.
If the levels are broken consecutively, the technical picture will change and the market will have to look for the next area of demand.
Gold is no longer just a story about inflation or the Fed rate. It is simultaneously a story about reserve assets, government debt, ETF flows, China, and the reallocation of global capital.
And that is why the current correction in XAU/USD is worth watching especially closely.
Do you want to trade gold and other global markets?
If you want to work independently withXAU/USD, currencies, indices and other financial instruments, you can open a trading account inAvora Marketsand gain access to trading infrastructure to operate in global markets.
Open a trading account with Avora Markets
The material is of an informational and analytical nature and does not constitute an individual investment recommendation. The levels shown at $4,292.75, $4,267.37 and $4,241.99 are taken from the chart provided and are used as technical references only.Trading financial instruments involves the risk of loss of capital.